
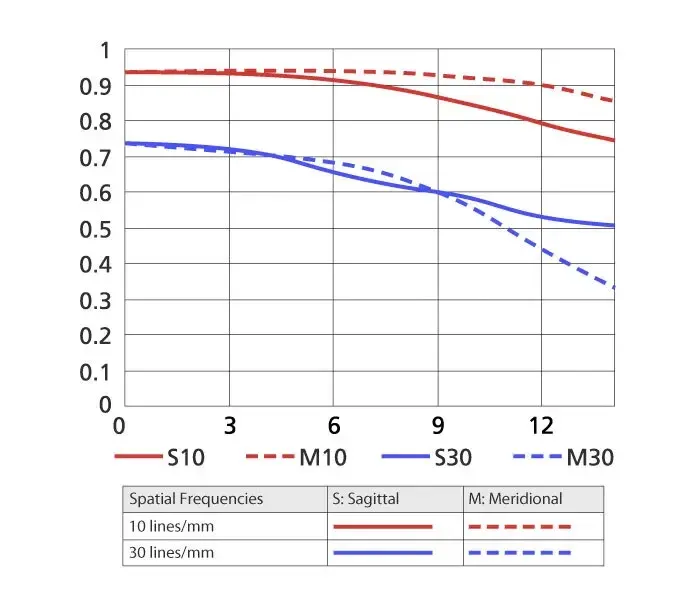
MTF charts are graphs that show how well a lens transfers contrast and fine detail from the center of the image to the corner. Higher lines mean better sharpness and contrast, solid and dashed lines show two kinds of detail orientation, and the gap between them hints at smoothness of blur and aberrations.
Why It Matters
Lens makers publish MTF charts for many lenses, and buyers often use them to compare. Knowing how to read them helps you separate marketing claims from real optical behavior, and you can predict where a lens will be sharp and where it will be soft.
Understanding the charts also shows their limits. They are a design prediction under specific conditions and cannot replace a real test or a look at sample photographs.
Beginner What MTF Charts Show
MTF stands for modulation transfer function. It measures how much contrast a lens preserves when imaging fine patterns. A value of 1.0, or 100 percent, means all of the contrast is retained, and 0 means the pattern disappears. The horizontal axis of the chart shows distance from the center of the image to the corner, in millimeters, and the vertical axis shows the MTF value from 0 to 1. Each chart plots several lines for different line frequencies, such as 10 and 30 lines per millimeter.
Reading The Lines
- A line at 10 lines per millimeter describes overall contrast, how punchy the image looks.
- A line at 30 lines per millimeter describes fine detail and sharpness.
- Solid lines usually represent sagittal detail, lines arranged along the radial direction.
- Dashed lines usually represent meridional detail, lines arranged around the center.
- The closer solid and dashed lines are to each other, the smoother and more natural the rendering tends to be.
Quick Guide To Interpreting Values
| What You See | Meaning | Practical Effect |
|---|---|---|
| High, flat lines near 0.9 and above | Excellent contrast and resolution across the frame | Sharp edge to edge |
| Lines dropping toward the corner | Corner softness | Weaker edges at the corner |
| Solid and dashed lines far apart | Astigmatism or other aberrations | Uneven blur at the edges |
| 30 lines per mm below about 0.5 | Limited fine detail | Soft at 100 percent view |
| 10 lines per mm above about 0.8 | Good global contrast | Punchy overall image |
How To Compare Two Lenses
- Make sure the charts are for the same aperture, usually wide open and at one stopped down value.
- Compare the 30 lines per millimeter lines first, which show fine detail.
- Look at the center, the middle and the corner separately.
- Check how close the solid and dashed lines are at each position.
- Then read independent test results and real sample photos before deciding.
Common Mistakes
- Comparing charts from different makers as if they use identical methods, when some are computed and others measured.
- Assuming the chart tells you about autofocus, distortion, vignetting or build quality.
- Ignoring the aperture the chart was made for, usually wide open.
- Judging a lens only from the center line, when most photographs need a good middle and corner.
A Worked Example
Imagine two 50mm lenses. Lens A shows 30 lines per millimeter at 0.85 in the center, 0.7 at the middle and 0.4 at the corner. Lens B shows 0.8, 0.75 and 0.65. Lens A is sharper in the center, but Lens B holds up better toward the edge. For landscapes where corners matter, Lens B may be more satisfying, and for portraits centered on the subject, Lens A may be fine.
Computed Versus Measured Charts
Some manufacturers publish charts calculated from the optical design, which assumes perfect manufacturing and no focus error. Others use measured data from real samples. Computed charts tend to look better than real life, so they are best used for comparison within one brand. Independent sites that measure real copies provide a useful second opinion, and variation between copies is another reason to test your own.
Aperture Matters
A lens is usually weakest wide open and improves when stopped down by one or two stops, then declines at very small apertures because of diffraction. A chart made at f/1.4 therefore looks worse than one at f/4. When reading a chart, check which aperture it represents. Many makers show a pair, wide open and f/8, so you can see both extremes.
Handy for this: Fast Prime Lens — creamy backgrounds, low light. (affiliate link)
Advanced Aberrations, Sensors And Real Photos
How Aberrations Appear In The Chart
Spherical aberration, coma, astigmatism and field curvature reduce contrast and spread solid and dashed lines apart. A gap between solid and dashed lines near the corner is a typical sign of astigmatism. The causes are discussed in lens aberrations, and field curvature explains why a flat target can be sharp in the center and soft at the edge at the same focus distance. Color fringing, covered in chromatic aberration, does not appear directly in a standard MTF chart.
Resolution Limits
The MTF at a given line frequency tells you what the lens can transfer, but the sensor also limits fine detail. A high-resolution sensor with small pixels needs a lens that performs well at higher frequencies. Related ideas are in pixel pitch and megapixels and the Airy disk. At small apertures, diffraction caps sharpness, as noted in the diffraction limit.
What The Chart Does Not Show
MTF charts do not describe distortion, vignetting, flare, focus breathing, autofocus speed, weight or price. A lens with a poor chart can still be a good choice for some uses if its character, rendering and cost suit you. A sharp lens with unpleasant blur can be less satisfying than a softer one with smooth rendering. Look at bokeh and lens testing to broaden the picture.
Using Charts In Buying Decisions
Use MTF charts as one input alongside reviews and samples. They help compare variations such as a fast prime and its slower sibling, or a lens against its replacement, as in prime versus zoom lenses and third party lenses. Remember that a lens that is sharper than your needs adds cost, weight and no visible benefit in prints or screen display.
Try It
- Find the published MTF chart for a lens you own or are considering.
- Identify the aperture, the line frequencies and the axis labels.
- Note how much the 30 lines per millimeter line falls from center to corner.
- Take a flat test shot at the same aperture and compare the corner softness to the chart.
Common Questions
What does a higher MTF line mean?
It means the lens preserves more contrast at that detail level. Higher is better, with values near 1.0 being the best theoretical performance.
Why are there solid and dashed lines?
They represent two orientations of test lines, radial and tangential. Lenses can resolve them differently, and a large gap between them often indicates astigmatism.
Can I trust manufacturer MTF charts?
They are useful for comparing lenses within the same maker, but they may be computed rather than measured. Independent measurements and your own tests give a fuller picture.
Does an MTF chart tell me if a lens is good?
Only partly. It shows sharpness and contrast but not distortion, autofocus, flare or rendering. Consider the whole lens, not one graph.
Related Lessons
- Lens Aberrations to see what lowers MTF.
- Lens Testing to measure a real copy.
- Chromatic Aberration for a defect MTF does not show.
- Field Curvature for why corners can be soft.
- Fast Lenses to see how wide apertures affect sharpness.
Gear That Helps With This
Hand-picked kit that makes this lesson easier to put into practice.
Some links are affiliate links: if you buy through them we may earn a small commission at no extra cost to you. How this works.