
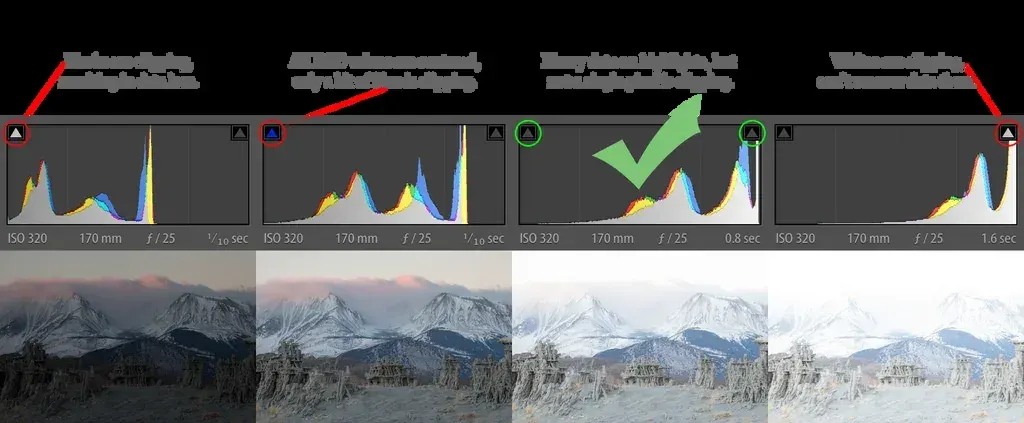
Reading histograms means looking at a graph of the tones in your photo, with shadows on the left, highlights on the right, and the height showing how many pixels sit at each brightness. A pile of data against either edge signals clipping, while a graph that stops short suggests the image could carry more light.
Why It Matters
The picture on a camera screen is a poor judge of exposure. Its brightness changes with the screen setting and the room light, and a small preview hides detail. A histogram is not affected by any of that. It reports the actual brightness values of the image, so it tells you whether highlights are blown out or shadows are crushed before you leave the scene.
It also takes the guesswork out of editing. Lightroom, Photoshop and video editors all use similar graphs, so the skill transfers to every tool you use.
Beginner Reading Histograms Step By Step
The horizontal axis runs from pure black on the left to pure white on the right. The vertical axis shows the number of pixels at each level. A tall peak on the left means many dark pixels, and a tall peak on the right means many bright pixels.
What The Shapes Mean
| Shape | Typical meaning | Usual fix |
|---|---|---|
| Data pushed to the left | Dark or underexposed image | Add exposure or open the aperture |
| Data pushed to the right | Bright or overexposed image | Reduce exposure |
| Spike touching the right edge | Clipped highlights | Lower exposure or protect the sky |
| Spike touching the left edge | Crushed shadows | Raise exposure or add fill light |
| Data bunched in the middle | Low contrast or flat light | Add contrast in editing |
| Data spread edge to edge | High contrast, full range | Check for clipping at both ends |
Using It In The Field
- Take a test shot and display the histogram, preferably over the image.
- Check whether the data touches either edge.
- If the right edge has a tall spike, reduce exposure with a faster shutter, smaller aperture or lower ISO, or use exposure compensation.
- If the left edge has a spike and you want shadow detail, increase exposure.
- Take another shot and confirm the change.
There Is No Perfect Shape
Beginners often chase a bell curve in the middle, but a good histogram depends on the scene. A snowy field produces a graph weighted to the right, and a night street produces one weighted to the left. Both can be correctly exposed. The question to ask is whether the tones you care about are captured without clipping.
Common Mistakes
- Treating a spike at the edge as always wrong, when a small amount of clipped specular highlights, such as the sun, is normal.
- Using the histogram of a JPEG preview to judge a RAW file, which has more room than the preview suggests.
- Ignoring the individual color channels, where one channel can clip while the overall graph looks fine.
- Adjusting exposure only by looking at the screen, without checking the graph.
A Quick Practice
Photograph a white wall, a gray wall and a black cloth under the same light. Compare the histograms, and note how the data moves from the right to the middle to the left. Then compensate exposure by one stop in each direction and watch the graph move.
Handy for this: Speedlight Flash — add light anywhere. (affiliate link)
Advanced Clipping, RGB Channels, RAW And Beyond The Basic Graph
Understanding Clipping
Clipping happens when brightness exceeds what the sensor or file can record, so values pile up at the maximum or minimum and detail is lost. Highlights clipped in all channels become pure white and cannot be recovered. A mild clip in one channel may be recoverable in a RAW file. Use highlight warnings, also called blinkies, together with the histogram. See highlight warnings and shadow detail recovery.
RGB Versus Luminance Histograms
A luminance histogram combines brightness across the image, while an RGB histogram shows red, green and blue separately. Saturated colors, such as a red flower or a blue sky, can clip in one channel long before the combined graph reaches the edge. If a bright red shows no texture, check the red channel. RGB histograms are especially useful for saturated subjects and sunsets.
The Histogram And RAW Files
The graph on the camera is calculated from the JPEG preview, which has contrast and color processing applied. A RAW file holds more information, so the real data often has more room than the graph suggests. Some photographers use a neutral picture style or a setting called UniWB to get a graph closer to the RAW data. See RAW versus JPEG, picture styles and expose to the right.
Dynamic Range And High Contrast Scenes
When the histogram has data touching both edges, the scene exceeds the sensor’s dynamic range. You must choose which end to protect, or use bracketing and blending. Learn more in dynamic range, exposure bracketing and HDR photography.
Using The Histogram In Editing
In Lightroom, the histogram panel updates as you move sliders. The whites and blacks sliders drag the ends of the graph, and holding Alt or Option while dragging shows clipping. The graph is also draggable: click on a zone and drag to change exposure, highlights, shadows, whites or blacks directly. See the Lightroom basic panel and Curves in Photoshop.
Histograms In Video
Video editors use waveform monitors and vectorscopes alongside or instead of histograms. A waveform shows brightness across the width of the frame, which helps with lighting and matching shots. See video scopes and Lumetri scopes.
Beyond The Graph
The histogram does not show where in the image the tones are, only how many. Combine it with the image preview, zebras and spot metering. Learn related methods in metering modes compared and exposure compensation.
Reading A Histogram For Different Subjects
Portraits in soft light usually form a hill in the middle with tapering ends. Landscapes with a bright sky and dark foreground often show two humps with a gap between them, indicating high contrast. Product shots on a white background show a tall spike at the far right, which is intended when you want a pure white backdrop. Learning how typical scenes look lets you recognize problems quickly.
Try It
- Turn on the histogram overlay in your camera’s playback or live view.
- Photograph a bright window scene, then lower exposure until the right spike leaves the edge.
- Switch to the RGB histogram and photograph a colorful subject, noting which channel clips first.
- Open a RAW file in your editor and compare the camera graph with the editor’s graph.
Common Questions
What does a histogram show?
It shows how many pixels in the image are at each brightness level, from black on the left to white on the right. It helps you judge exposure objectively.
What is a good histogram for a photo?
There is no single shape. A good histogram captures the tones you care about without clipping important highlights or shadows. A bright scene will lean right, and a dark scene will lean left.
Does a spike on the right mean overexposure?
Often yes, if it touches the edge and includes important detail. Small spikes from the sun or reflections may be acceptable.
Should I use the RGB histogram?
It is useful for saturated colors, since one channel can clip even when the overall graph looks fine. Many photographers use both.
Related Lessons
- Expose To The Right to get the cleanest RAW data.
- Highlight Warnings for a visual clipping check.
- Exposure Compensation Guide for correcting what the meter misses.
- Dynamic Range Explained for scenes that exceed your sensor.
- Lightroom Basic Panel for adjusting the tones you see on the graph.
Gear That Helps With This
Hand-picked kit that makes this lesson easier to put into practice.
Some links are affiliate links: if you buy through them we may earn a small commission at no extra cost to you. How this works.